
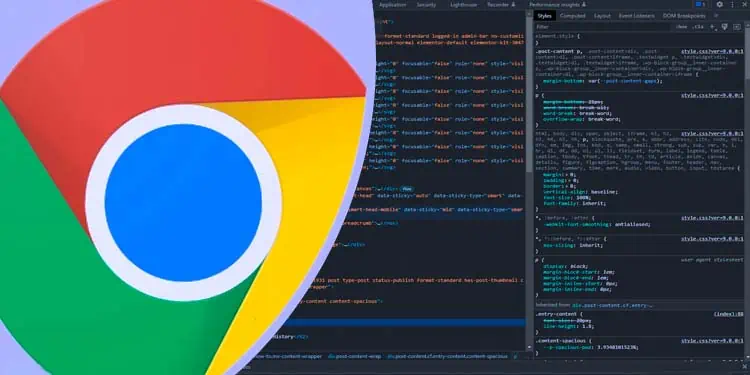
The Chrome Developer Tools is a set of web-building toolkits that are directly built into the Chrome browser. It is a front-end developer toolkit mainly used for debugging, editing, and optimizing web pages.
If you’re a website owner or developer, Chrome Developer Tools offers various functions you can use to optimize your website for better user experience, test device compatibility, and improve SEO ranking.
So, even if you have little to no programming knowledge as a website owner or a budding developer, it is pretty good to learn the basic use of Chrome Developer Tools. First, we’ll show how you can access the Developer Tools in Chrome.
Using keyboard Shortcuts
The easiest way to open Developer Tools in Chrome is by using the keyboard shortcuts. You can simply press the Ctrl + Shift + C hotkey to directly open the Elements tab in Developer Tools. The Elements tab will show the attributes and CSS of all the elements present on the webpage.

If you’re trying to run Javascript or check the log and error messages of a webpage, you might want to open the Console tab in Developer Tools. You can use the Ctrl + Shift + J shortcut key to go directly to the Console tab.
Lastly, you can either use the Ctrl + Shift + I or the F12 key to open the last active tab in Developer Tools. For MacOS, the shortcut keys are roughly the same, and you only need to swap out the Ctrl key with the Command key and the Shift key with the Option key to perform the equivalent shortcut.
Using Chrome User Interface
Another way you can open Developer Tools in Chrome is from the user interface itself. If you want to inspect the attributes of any element in Developer Tools, you can simply right-click it and select Inspect. It will directly open the Elements tab and lead you to the corresponding element attributes.

You can also go to the Chrome menu in the top right, select More tools, and click on Developer tools to open it. This will lead you to the last active tab in your Developer Tools.
How to Use Chrome Developer Tools?
You can use Chrome Developer Tools for a variety of purposes like inspecting and editing a page’s HTML elements, debugging your code, viewing log files, and also measuring a webpage’s performance.
However, any changes you make in Chrome Developer Tools are only temporary and only affect the client side. As soon as you reload the webpage, the changes should revert back. Nonetheless, these temporary changes are still very useful for further optimizing a website.
While you are certainly expected to have a little programming knowledge to use Chrome Developer Tools, you can still get some basic use out of it with no programming knowledge.
Before we begin, let’s get you a basic rundown of the few key tabs in Developer Tools.
- Elements tab: It lets you view and edit the HTML and CSS source code of the webpage.
- Console tab: It lets you run Javascript to interact with the webpage you’re viewing, and it also displays information about the interactive elements of a webpage.
- Source tab: It shows you all the source files used to make that particular web page and their file directory.
- Network tab: It lets you view all the network requests of a webpage that is needed to load it.
- Security tab: It shows a basic security overview of the webpage you’re viewing.
- Performance tab: It lets you record a page load process and analyze it to check your website performance.
View Your Website on Different Devices
Using the Chrome Developer Tools, you can view how your website looks on different devices. While your website may look beautiful on desktop devices, it may not look as good on the smaller screens of smartphones.
So, you can test with different devices to see how your website will look with each of them, and you can use this information to optimize your website for them.
- Open Developer Tools.
- Click on the smartphone and tablet icon beside the Elements tab. (You can also use the Ctrl + Shift + M shortcut to directly switch to smartphone or tablet viewing.)

- Click on the Dimensions Responsive drop-down menu to select from any of the preset devices. (This will directly show how your website will look on that device.)
- You can also leave it as Responsive, and set custom dimensions to replicate a particular smartphone’s display.


Check Page Load Speed and Network Requests
You can also check how fast your webpage loads from the Chrome Developer Tools. Website load speed is a crucial thing, as it massively affects website traffic and SEO ranking. Nobody likes waiting for a slow website to load, and it is essential you know how long your website needs to load and why.
- Open Developer Tools.
- Go to the Network tab.
- Click on the Reload button to refresh your page.
- You can see your website load speed at the bottom right in the three parameters, Finish, DOMContentLoaded, and Load.
- DOMContentLoad: It will show how long it took to load the HTML code for your webpage.
- Load: It shows the amount of time needed for the web page to fully load.
- Finish: It shows when all the HTML code, elements, and other stuff are fully done.
- You can also see the total network requests from the webpage and the resources used.
- Additionally, you can also check your load speed together with the above method to see your web page load speed on different devices.
- You can also choose from No throttling, Mid-tier mobile, or Low-end mobile to see the load speed in different performance phones.


Analyze Your Website SEO
You can also check if your website is following basic search engine optimization (SEO) advice from the Lighthouse tab in Chrome Developer Tools. While it only performs a basic level SEO check, you can still find useful tips to make your website rank higher in search engine results or make sure your website is following all basic SEO guidelines.
- Open Developer Tools.
- Click on the two right arrows icon beside the tab menu and select Lighthouse.
- Select the Mode to be Navigation (Default), and choose which Device to conduct the test for.
- From Categories, select SEO and uncheck the rest.
- Click on Analyze page load.
- It should take about 30 seconds for your SEO results to load.


Additionally, you can perform just about any test from the different categories present in the Lighthouse report like Performance or Best practices.
Lastly, if you want a full guide from basic to advanced levels of utilizing Chrome Developer Tools, you can go to Chrome’s own DevTools Documentation.