
You can check both the core and package temperature of your CPU using a reliable hardware monitoring utility, like HWMonitor, HWiNFO64 etc. Just navigate to the CPU section to access the data.
Alternatively, you can also check the CPU temperature in your Windows 11 System using the manufacturer’s companion application. While at it, look for CPU Core Temperature.
Make sure not to confuse this with the CPU Socket Temperature though. The latter is one of the temperature sensors on your motherboard and will have a slightly lower value.
For those who prefer not to install a separate software, the system’s BIOS also includes a section for checking CPU temperature.
I usually prefer the first two methods when I need to check CPU temp. This way, I can simultaneously stress test the CPU and see how the temperature fluctuates.
Check Using CPU OEM Applications
Both Intel and AMD CPUs offer their own tuning utility. Intel’s OEM (Original Equipment Manufacturer) application is the Intel Extreme Tuning Utility. For AMD, it’s Ryzen Master.
I have an AMD Ryzen CPU. So, I am using Ryzen Master for the process.
- Download Ryzen Master or Intel Extreme Tuning Utility depending on your CPU.

- Once the download completes, run the setup file and follow the installation process.
- Open the application.
- In the home screen of the application, you can check the CPU temperature.


Using Motherboard OEM Applications
Motherboard manufacturers also provide users with their dedicated application to monitor internal components.
These applications are likely pre-installed on a laptop. For the desktop PC, you need to install them depending on your motherboard.

They also provide a wide range of services from clock speed to usage. And this includes the CPU temperature as well.
| Motherboard | OEM Utilities | Relevant Section |
| MSI | MSI Center or Dragon Center | Hardware Monitoring > CPU Temp |
| Gigabyte | Easy Tune | Triangle icon on the left side of the window |
| ASUS | AI Suite 3 | Temperature > CPU Temp |
| ASRock | Blazing OS Tuner | System Health > CPU Temp |
Use Hardware Monitor Apps
If your motherboard doesn’t offer a companion application, you can opt for a third-party application. There are numerous applications that can access readings from the sensor built into your CPU.
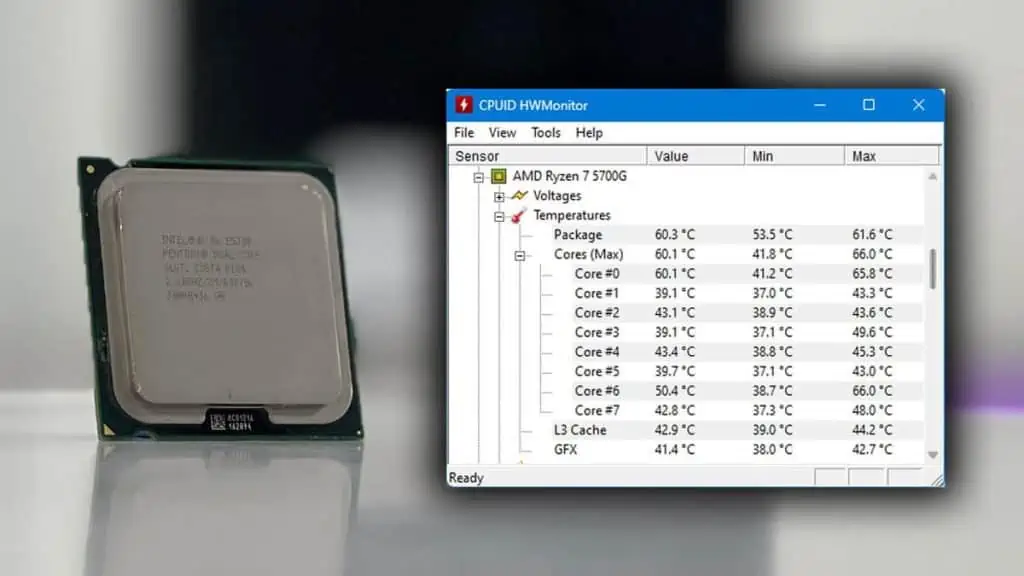
Personally, I prefer an open-source application named HWMonitor from CPUID.
- Head over to CPUID’s official website.
- Select your OS and click on Setup English.
- Click on Download Now. An executable file should now start to download.
- Run the setup file, and follow through the installation process.
- Once the installation is completed, run HWMonitor.
- Scroll down to your CPU name. Here, you can see voltages, power, currents, clock speed, etc.
- Under Temperatures, you can see all your CPU temperature readings, current, minimum, and maximum.


Let me go through each of the temperatures, and what it means.
The temperature reading in Package is the overall temperature of the CPU chip. This is a combination of each CPU core, L3 Cache, and GFX.
When you expand Cores, you will see the temperatures of all your CPU cores. Since I use a Ryzen 7 5700G and have a total of 8 cores, I have Core # 0 through 7.

L3 cache and GFX reads your CPU’s L3 cache and integrated graphics card temperatures respectively.
If you are overclocking your CPU, I recommend that you keep an eye on Core temps instead of Package temps.
From BIOS
Most, if not all, CPUs have a thermal sensor. You access data from this sensor using the BIOS.
Most motherboards, especially the latest ones, have a BIOS setting to check CPU temp.
- From Windows, boot into the Advanced Startup menu.
- Navigate to Troubleshoot > Advanced Options > UEFI Firmware Settings.
- Click on Restart.
- Once you are in UEFI BIOS, search for a setting named Fan Curve, Smart Fan or Hardware Monitor.
- Make sure CPU_FAN is selected.
- You can also get the CPU temperature from EZ mode in BIOS.
- Once you are done, exit the BIOS.


What are Ideal and Dangerous CPU Temperatures?
Whether you are overclocking or using it normally, the CPU temperature should be well below 95°C. However, the ideal temperature also depends on CPU usage.
Furthermore, a CPU also has a maximum thermal limit. As long as the CPU stays below this temperature, it will operate without thermal throttling.
If you are looking for an ideal temperature, I recommend that you check your processor’s specification page online.

As a general rule of thumb, the CPU should stay under 55° to 60°C when idle. On medium or around 50% CPU load, it should stay under 80°C. And finally, on high load, the temperature should stay below 95°C.
| CPU Temperature | CPU Idle | 50% CPU Usage | Full Load (100%) |
| Good | Under 60°C | Under 80°C | Under 90°C |
| Okay | 60°C to 65°C | 80°C to 85°C | 90°C to 95°C |
| Bad | Above 65°C | Above 85°C | Above 95°C |
The CPU performance starts to degrade at high temperatures as it starts to thermal throttle.
Running a CPU at a high temperature also decreases its life span.
Personally, I try to keep my CPU temp under 90°C on full load. If it starts to exceed 95°C, I change its thermal paste, and clean all the CPU fans and also the heatsinks.
If your CPU temp is constantly high, I recommend you do the same to lower CPU temp.